
Measuring Australia’s Manufacturing Innovation
Authors: Shaun van Dijk, Siobhan Malone
Manufacturing remains one of Australia’s most critical economic pillars—responsible for almost 6% of total industry output and 8% of exports [1]. Yet the sector’s true impact extends beyond its contribution to GDP. It is in research, development, and innovation that Australian manufacturing has demonstrated an ability to continually punch above its weight, driving productivity, competitiveness, and resilience in a fast-changing economy.
Whilst Australian manufacturing has been a leading sector in terms of R&D investment and innovation activity, this analysis unpacks the sector’s more recent performance and the latest trends across multiple dimensions of innovation, including:
business expenditure on R&D,
level of innovation activity,
intellectual property creation, and
participation in incentive schemes and government grant programs.
Together, these indicators provide a snapshot of how Australian manufacturing innovation and R&D investment is tracking, the impact of emerging challenges, and the strategic opportunities to strengthen the sector’s innovation performance.
Business Expenditure on R&D
The latest Australian business R&D data released from the ABS, covering the 2023-24 financial year, assesses Business Expenditure on R&D (BERD) and human resources devoted to R&D across the Australian industry landscape. Key insights are summarised below and in the graphs provided:
The manufacturing industry reported the second highest BERD in terms of contributions measured by industry, assessed at $5.047 billion in 2023-24 and contributing 21% to the total BERD [2] (Figure 1). This is a decrease of 3% from FY22 ($5,203 million, 25% of BERD) [2].

Figure 1: BERD, by top ten industries. Data from ABS. [2]
In terms of socio-economic objectives, which classifies expenditure based on the perceived purpose/outcome of the R&D, manufacturing ($4.644 billion in 2023-24) has lost the top position to information and communication services [2] (Figure 2). Manufacturing has experienced a steady decrease over each reporting period, compared to the other major sectors which have experienced increases.
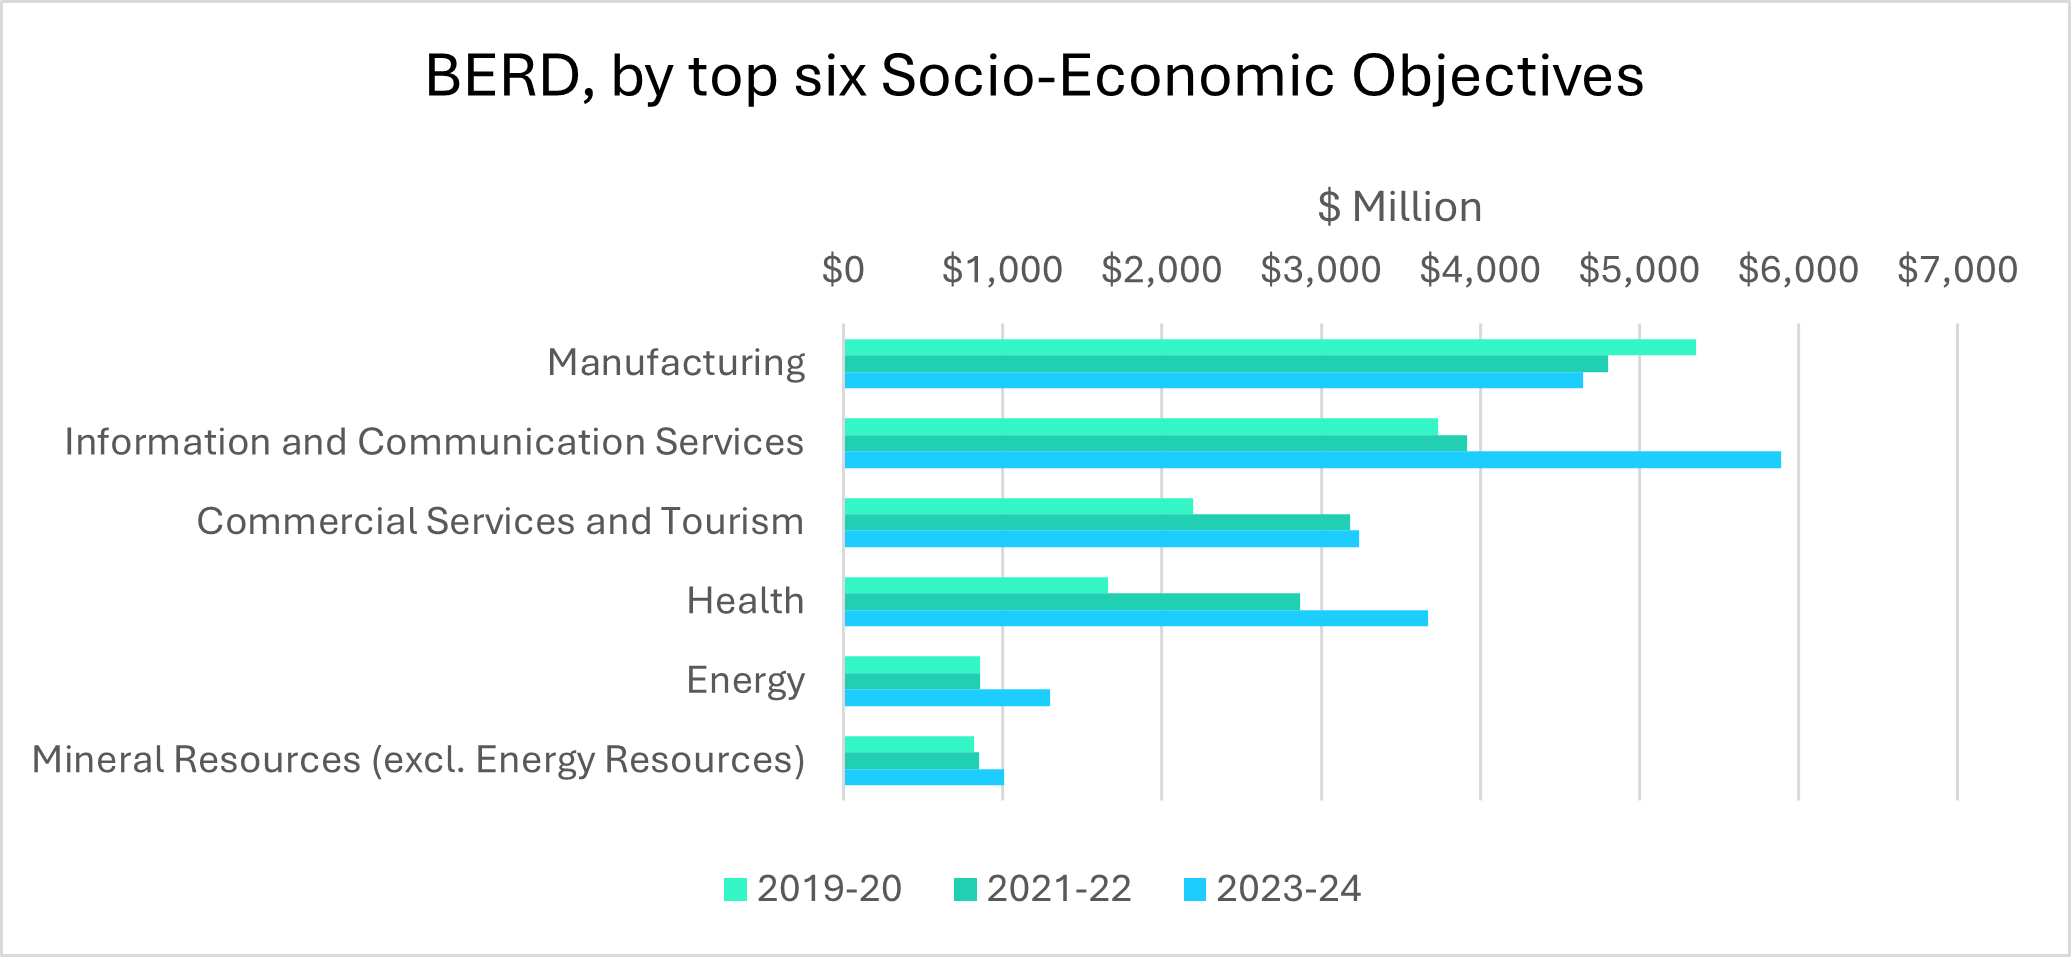
Figure 2: BERD, by Top Six Socio-Economic Objective. Data from ABS [2]
Other Measures of Innovation in Australian Business
Innovation in Australian Business
The ABS also provides other measures of innovation participation beyond business expenditure R&D, including within its 2024 report entitled “Innovation in Australian Business”.

Figure 3: Innovation-Active Businesses by Industry, Two Years Ended 30 June 2023. Data from ABS [3]
The data in this ABS report provides interesting insights into the “innovation activity” of businesses in 2022-23. For example:
58% of manufacturing businesses were identified to be “innovation active”. This is significantly higher than other industries and compares favourably to the average for Australian businesses, recorded as 46% [3] (Figure 3).
As per DISR’s publication “Australian Innovation Statistics”, the percentage of innovation active manufacturing businesses has increased from 2016-17 and from 2010-11 [4]. This places manufacturing as the industry with the third most innovation active firms in 2022-23 [4].
IP Australia data
Another insightful measure of the level and reach of innovation in Australian manufacturing is provided by the registerable Intellectual property (IP) that has been created over time. This can be used to understand the scope of innovation and new knowledge being generated by Australian businesses, as well as the amount of collaboration and research partnerships taking place.
While definitive year-by-year breakdowns of Australian manufacturing patents isn't readily available, recent analysis by IP Australia provides a helpful source of information related to patent activity and IP development across Australian industries and sectors. For example, key findings from IP Australia’s 2024 report (“The Business Environment of Patenting Firms in Australia”) [5] were as follows:
The number of filed patents has increased between 2011 and 2021 (from approx. 3,000 to approx. 3,750).
In general, IP creation and patenting activity in Australia is concentrated in three key industries: manufacturing, wholesale trade, and professional scientific and technical services.
Collaboration is identified to be a crucial feature of firms engaged in R&D activities in Australia. Manufacturing and professional, scientific and technical services stand out with the most overseas partners
Furthermore, of the industries where patenting is more common practice, manufacturing businesses were identified to commonly have a higher number of collaboration partners.
R&D Expenditure Outlays
Department of Industry, Science & Resources data
The Department of Industry, Science and Resources (DISR) publishes annual data regarding R&D and innovation outputs of Australian businesses. Provided below is analysis of the trends in business R&D expenditure by industry between 2006 and 2022.
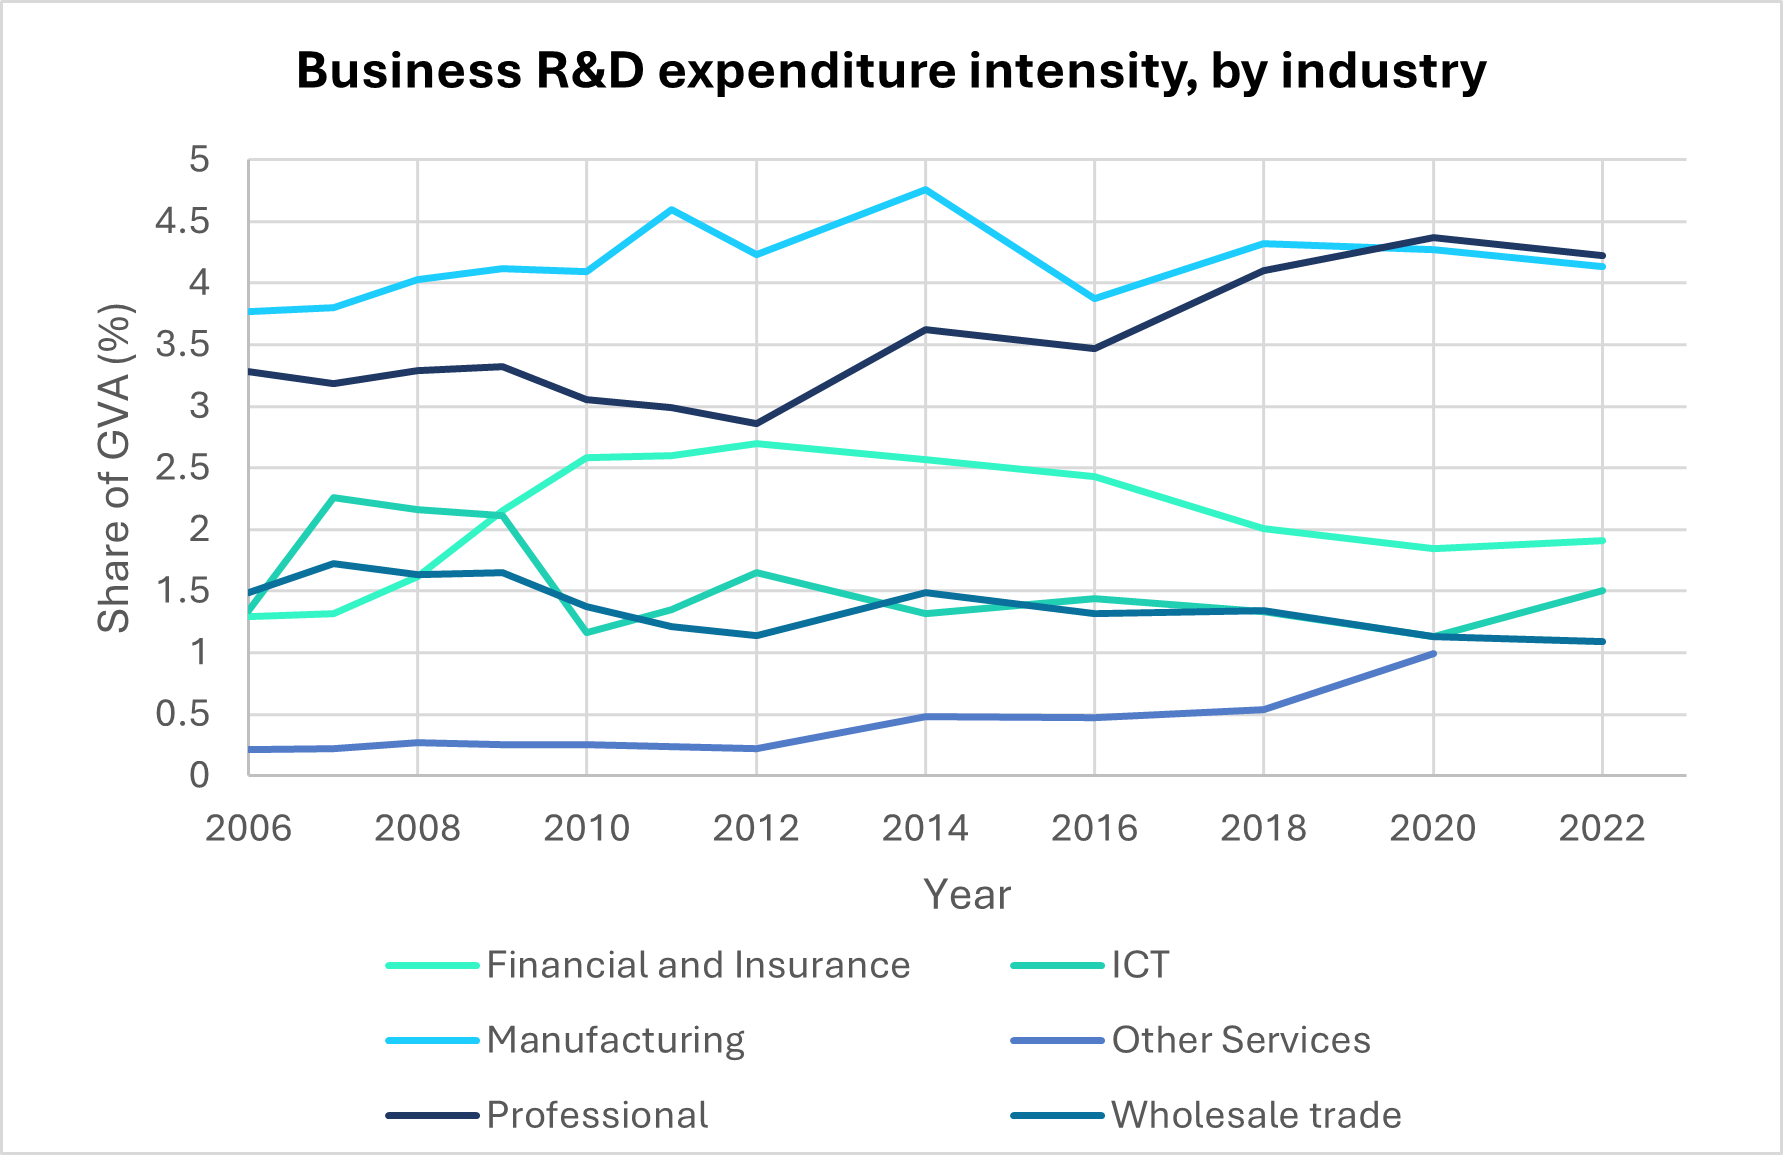
Figure 4: Business R&D expenditure intensity, by industry. Data from the DISR [6]
Some interesting insights from the DISR data include:
Manufacturing has historically had the highest share of gross value added in industry (approx. 4%), demonstrating that the sector has maintained a stable lead in R&D expenditure intensity [6].
Manufacturing was overtaken in 2020 by the continued rise in R&D expenditure from the professional, scientific and technical services sector [6] (Figure 4).
Australian Tax Office data
Manufacturing was in the top five industries identified to be accessing the R&D Tax Incentive in the 2021-22 income year as per the inaugural Australian Tax Office (ATO) R&D Tax Transparency Report (published in October 2024). Manufacturing businesses were defined as those primarily engaged in “the physical or chemical transformation of materials, substances or components into new products (except agriculture and construction)” [7].
The R&D Tax Transparency Report provided an encouraging picture of the role of the manufacturing to Australia’s R&D output. For example:
Manufacturing represented the 2nd highest industry in terms of 2021-22 R&D expenditure at $2.47 billion (Professional, Scientific & Technical Services represented the leading industry) [7]. See Figure 5 below.Manufacturing accounted for 21% of the businesses accessing R&D tax entitlements approx. 2,451 companies in total) [7].
Manufacturing accounted for 21% of the businesses accessing R&D tax entitlements approx. 2,451 companies in total) [7].
In total, 20% of the small businesses accessing R&D tax entitlements and 24% of privately owned & wealthy group claimants are manufacturers [7].

Figure 5: Top R&DTI Industries by Number of Claimants in FY22. Data from ATO [7]
The next ATO R&D tax transparency report is due to be released in late September 2025 and will measure R&D expenditure for the 2022-23 income year. However, there are already indications that during this period manufacturing operators continued to be significant R&D investors, accounting for 26% of all R&D Tax Incentive applications received [8].
Government Funding & Investment
Finally, it’s also worth summarising the major forms of government funding and support available to Australian manufacturers pursuing R&D, collaboration, innovation and expansion.
In summary, the manufacturing sector remains a significant focus of both State and Federal government funding, as evidenced by the scope of grant programs commonly made available for small, medium and large enterprises. According to a 2024 study by James Kavourakis et al., entitled “Efficacy of Commonwealth Government Business Grants”, it was established that the manufacturing sector accounts for the highest value of grants of any industry group or sector in Australia [9].
For example, in the last 12-18 months Queensland has offered at least five distinct grant programs that are specifically geared to manufacturers, including:
Made In Queensland
Remade In Queensland
Manufacturing Energy Efficiency Grant Program
Manufacturing Sustainability Benchmark Program
Manufacturing Hubs Grant Program [10].
Additionally, the most recent Cooperative Research Centre (CRC) Grant rounds (Round 24 & 25) included three recipients with a manufacturing focus out of the five total recipients:
Solving Plastic Waste CRC ($40 million)
Additive Manufacturing CRC ($57.5 million)
Solutions for Manufacturing Advanced Regenerative Therapies CRC (SMART CRC) ($65 million) [11].
At a Federal Government level, successive governments have provided substantial grant and funding support to Australia’s manufacturers. Several years ago, the major program available was the Modern Manufacturing Initiative. This has been replaced by the Albanese government’s National Reconstruction Fund (NRF). The NRF was launched in 2023 with a budget of $15 billion and an objective of investing in transformational projects that supports Australia’s manufacturing capabilities across 7 priority areas, including:
Value-add in resources
Value-add in agriculture, forestry and fisheries
Transport
Medical science
Renewables & low emission technologies
Defence
Enabling capabilities (including advance manufacturing, AI technologies, robotics, etc.).
To complement the NRF, the Federal government has also established the Industry Growth Program (IGP) with a $392 million budget and the task of specifically supporting startups and SMEs to commercialise ideas and grow their business via projects that develop Australia’s industry and manufacturing capability.
Conclusion & Key Takeaways
Underlying the recent data regarding Australia’s manufacturing innovation performance is an emerging R&D investment crisis with reports identifying Australia’s annual R&D spending has fallen to 1.69% of GDP, well below the OECD average (2.7%) and representing one of the lowest levels among developed nations [2, 12].
Our analysis indicates Australia’s manufacturing sector is not immune from these R&D investment challenges and is nearing an inflection point. While manufacturing continues to be a significant contributor to national R&D and innovation activity, the national trend of declining R&D investment and total business expenditure is also reflected in Australia’s manufacturing sector.
In our view, key takeaways from our analysis are as follows:
Prioritise innovation culture & commitments to R&D – With 58% of manufacturers classified as innovation-active, the sector leads Australia in experimentation and improvement. Pursuing R&D and embedding innovation has been a critical factor driving Australian manufacturing and should continue to be prioritised and supported.
Leverage government incentives – The R&D Tax Incentive and new programs like the National Reconstruction Fund, Industry Growth Program and various State-government grant funds are designed to support manufacturers in a variety of ways regardless of their size and maturity. If planned for and pursued strategically, these government funding programs can offset costs, de-risk innovation projects and support critical business investments.
Focus on transformation & collaboration – The shift towards advanced manufacturing, digitalisation, and sustainable production is not optional – it is the pathway to growth, resilience, and global competitiveness. Australian manufacturers have also demonstrated high rates of collaboration, particularly with overseas partners, and it is important they continue to cultivate strategic partnerships with research institutions, industry peers, and global partners to benefit from emerging research and new technologies.
Protect and commercialise IP – Manufacturing remains one of the strongest industries for patent activity and IP development in Australia. It remains vital for manufacturers to continue investing in IP development and protection to help unlock long-term commercial returns via licensing and other means, achieve effective knowledge creation and management, and establish competitive advantages against global competitors.
In the face of reducing R&D investment, the opportunity exists for Australian manufacturers to buck the national trend and continue investing in innovation and the pursuit of strategic research and overseas partnerships. In our view this will be critical for the manufacturing industry to not only rapidly adapt but to also thrive in the face of economic transition, rising energy costs, rapid technological change and demands for adaptation to more sustainable practices.
References
[1] The Reserve Bank of Australia, “Composition of the Australian Economy Snapshot,” 9 July 2025. [Online]. Available: https://www.rba.gov.au/education/resources/snapshots/economy-composition-snapshot/. [Accessed 10 July 2025].
[2] Australian Bureau of Statistics, “Research and Experimental Development, Businesses, Australia,” 22 August 2025. [Online]. Available: https://www.abs.gov.au/statistics/industry/technology-and-innovation/research-and-experimental-development-businesses-australia/latest-release. [Accessed 25 August 2025].
[3] Australian Bureau of Statistics, “Innovation in Australian Business,” 20 June 2024. [Online]. Available: https://www.abs.gov.au/statistics/industry/technology-and-innovation/innovation-australian-business/2022-23. [Accessed 27 April 2025].
[4] Department of Industry, Science and Resources, “Innovation outcomes,” 18 October 2024. [Online]. Available: https://www.industry.gov.au/publications/australian-innovation-statistics/innovation-outcomes. [Accessed 27 April 2025].
[5] F. Menezes, T. Rampino and M.-L. Verreynne, “The Business Environment of Patenting Firms in Australia,” October 2024. [Online]. Available: https://www.ipaustralia.gov.au/tools-and-research/professional-resources/data-research-and-reports/publications-and-reports/~/-/media/Project/IPA/IPAustralia/PDF/Publications-and-reports/The-business-environment-of-patenting-firms-in-Australia.pdf. [Accessed 27 April 2025].
[6] Department of Industry, Science and Resources, “Research and development expenditure,” 18 October 2024. [Online]. Available: https://www.industry.gov.au/publications/australian-innovation-statistics/research-and-development-expenditure. [Accessed 27 April 2025].
[7] Australian Taxation Office, “Industry overview,” 3 October 2024. [Online]. Available: https://www.ato.gov.au/businesses-and-organisations/income-deductions-and-concessions/incentives-and-concessions/research-and-development-tax-incentive-and-concessions/research-and-development-tax-incentive/r-d-tax-transparency-reports/r-d-tax-incentive-transparency-report-2021-22/industry-overview. [Accessed 27 April 2025].
[8] Industry Innovation and Science Australia, “Industry Innovation and Science Australia annual report 2023–24,” 29 November 2024. [Online]. Available: https://www.industry.gov.au/sites/default/files/2024-11/iisa_23-24_annual_report_web.pdf. [Accessed 30 April 2025].
[9] J. T. G. a. Z. M. Kavourakis, “Efficacy of Commonwealth Government Business Grants,” 2024. [Online]. Available: https://www.deakin.edu.au/__data/assets/pdf_file/0006/2807313/2024-deakin-efficacy-of-australian-commonwealth-business-grants-white-paper.pdf.
[10] Queensland Government, “Manufacturing grant programs,” 10 December 2024. [Online]. Available: https://www.business.qld.gov.au/industries/manufacturing-retail/manufacturing/grant-programs.
[11] business.gov.au, “Current Cooperative Research Centres (CRCs),” 8 August 2025. [Online]. Available: https://business.gov.au/grants-and-programs/cooperative-research-centres-crc-grants/current-cooperative-research-centres-crcs. [Accessed 25 August 2025].
[12] Organisation for Economic Co-operation and Development, “Science, Technology and Innovation Scoreboard,” 2 May 2025. [Online]. Available: https://www.oecd.org/en/data/datasets/science-technology-and-innovation-scoreboard.html. [Accessed 18 September 2025].