Authors: Shaun van Dijk, Siobhan Malone
The ATO has now released three years’ worth of R&D Tax Incentive (R&DTI) claim information as part of their annual transparency reporting, providing a snapshot of Australian business R&D investment over this time. In combination with other innovation reports and measures such as the Global Innovation Index, the R&DTI transparency reporting provides an insightful snapshot of Australian industry R&D and innovation performance.
FY2023-24 Overall
In the most recent R&DTI transparency report, released September 2026, the ATO reported R&D expenditure figures for Australian businesses that accessed the R&DTI program in the 2023-24 financial year. In summary:
13,490 companies accessed the R&DTI program and claimed a combined $16.7 billion in eligible R&D expenditure (ATO, 2026).
Once all amendments are accounted for, this is a 2.2% and 3.5% increase on the total R&D expenditure and number of R&DTI claimants, respectively, compared to the FY2022-23 data.
Despite the increased scope of claims, the growth in reported R&D expenditure and claimants in the last 12 month reporting period has slowed in comparison with the prior 12 months (11.3% growth in FY2023-24 compared to 42.9% in FY2022-23). This is likely due to under reporting in the inaugural FY2021-22 report (e.g. companies with a non-standard income period were not required to report until FY2022-23).
R&D Entity Trends
One of the most notable findings is the contribution of smaller businesses to the overall growth in R&D expenditure.
Small businesses (less than $10mill turnover) have been driving the growth of the R&DTI over the last three years in terms of claimant numbers and now represent 51% of claimants (up 15% from the prior report). These small businesses reported $3.1 billion in R&D expenditure in FY24, reflecting 18.56% of total R&D expenditure across all claimants.
Conversely, whilst public and multinational businesses only account for 18.16% of total R&DTI claimants in FY24, these businesses make up 53.89% of R&D expenditure claimed in the program accounting for the largest share of reported R&D expenditure.
Both of these populations have grown year on year in terms of total number of claimants and total R&D expenditure. By comparison, privately owned and wealthy groups businesses (greater than $10mill turnover, not publicly listed or multinationals) accessing the R&DTI program declined by 9% in claimant numbers from FY2022-23 to FY2023-24.
While the ATO notes that some of these movements reflect changes in business classifications, the figures highlight the important role smaller businesses play in Australia's R&D ecosystem.
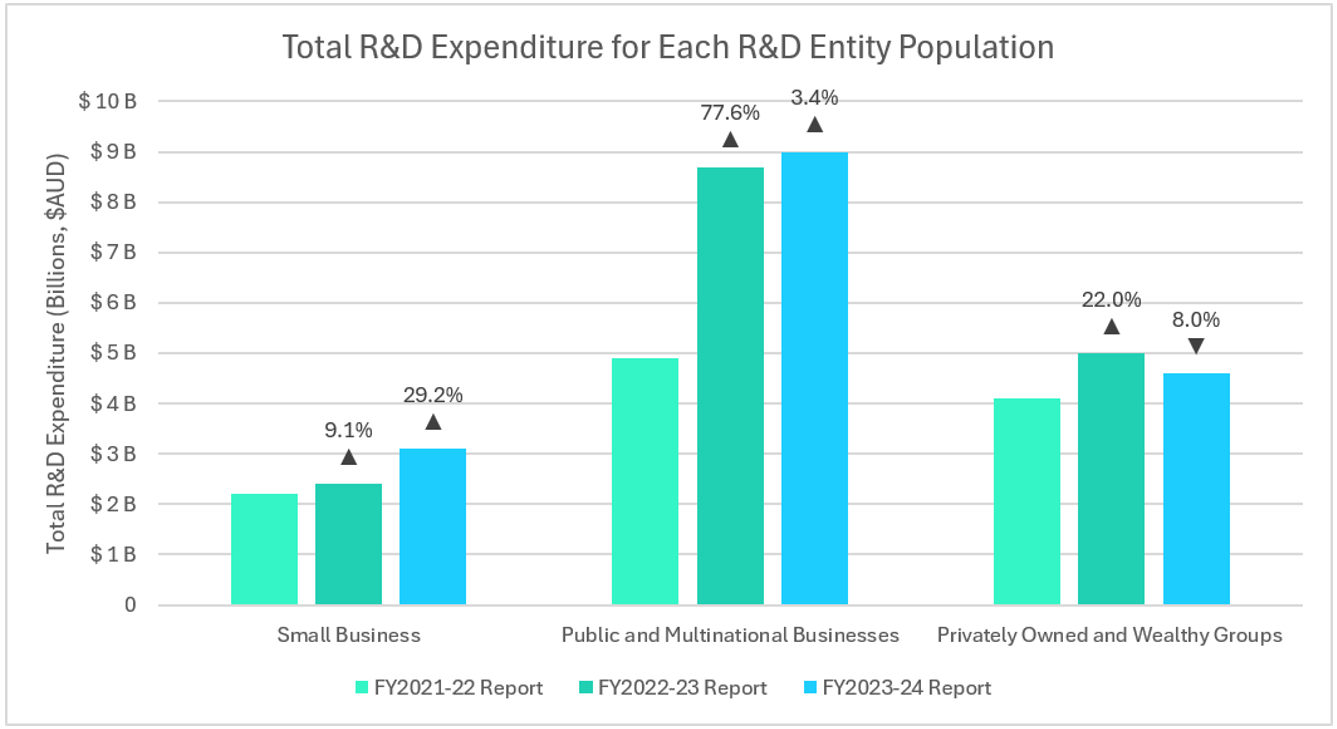
Figure 1: Total R&D Expenditure from FY22-FY24, per the ATO Transparency Reports, for each entity population. Note that this does not account for amendments made in later financial years and only represents the numbers at the time of first reporting. Non-for-profits have been excluded due to minimal data.
R&D Industry Trends
Entities in the professional, scientific and technical services industry continue to be the overall largest sector to claim the R&D, both in terms of claimants (44.14%) and total R&D expenditure ($6.5 billion, or approx. 39%).
Manufacturing remains the second-largest contributor, with $3.56 billion in expenditure, although this was marginally lower than the previous year.
Other notable industry R&D expenditure movements included:
Mining expenditure declining by 7.3%.
Financial and insurance services increasing by 11.3%.
Electricity, gas, water and waste services increasing by 21.2%.
Health care and social assistance increasing by 11.8%
These results suggest that R&D investment is growing at different rates across the economy, with some emerging areas demonstrating stronger momentum than traditional sectors.
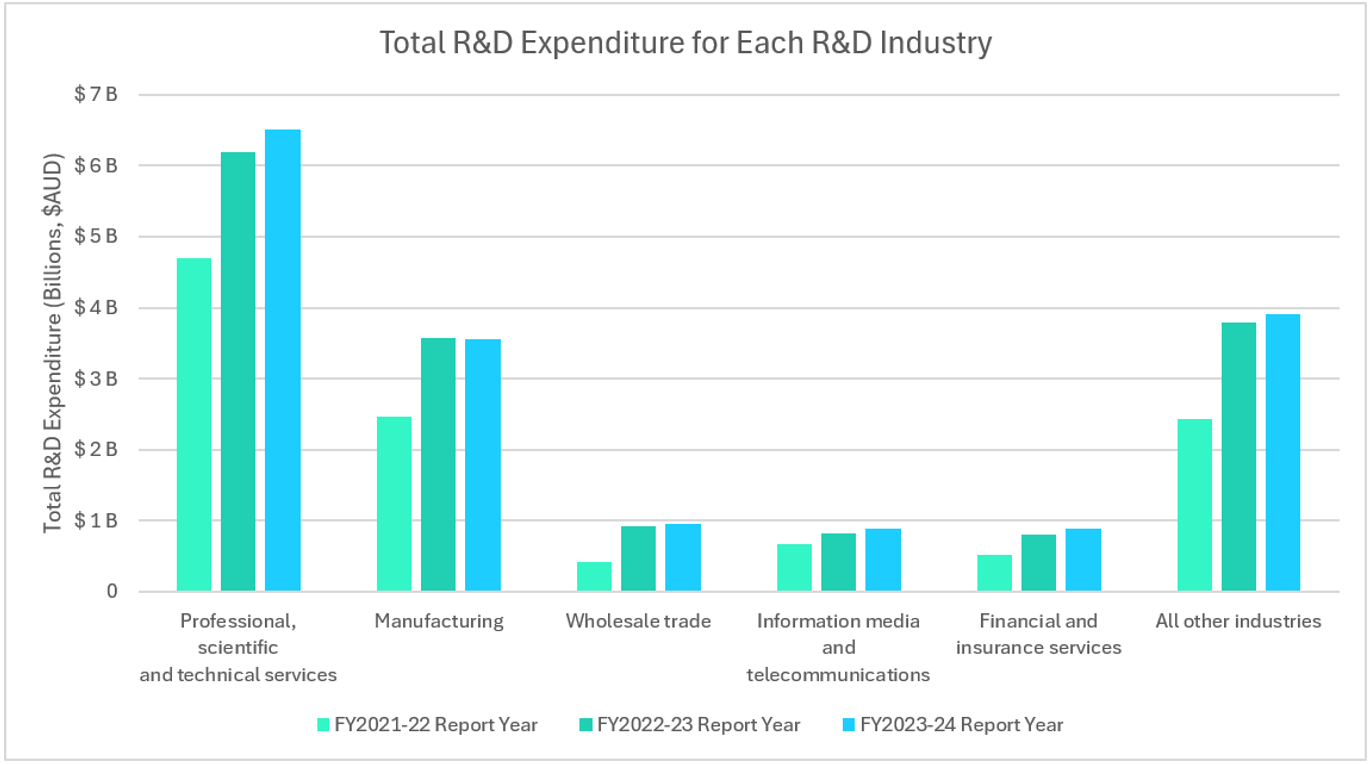
Figure 2: Total R&D Expenditure from FY22-FY24, per the ATO Transparency Reports, for the top 5 R&D Industries. Note that this does not account for amendments made in later financial years and only represents the numbers at the time of first reporting.
Global Innovation Index
The release of the ATO R&DTI transparency data coincides with the 2026 Global Innovation Index (GII), published by the World Intellectual Property Organization (WIPO).
The latest GII index establishes that Australia’s global innovation standing has improved slightly from the prior year, up from 22nd to 20th in the world (WIPO, 2026). The primary areas that supported Australia’s improved innovation standing were Australia’s universities (4th), strong university-industry R&D collaborations (6th) and improvement in cluster developments (5th) (WIPO, 2026). These key areas are clear and consistent areas of strength for Australia’s innovation ecosystem.
Despite our university-industry collaborations, Australia’s rankings in the innovation inputs and outputs index show that less innovation outputs are produced for the level of investment into innovation. Australia’s ranking in innovation outputs (24th) continues to lag behind our ranking in innovation inputs (13th) (WIPO, 2026). Gross expenditure on R&D is one of six factors driving the innovation input score.
Viewed together, the ATO and WIPO datasets present an interesting picture of Australia's R&D investment and innovation performance in the last 4-5 years. In summary, Australia has a substantial and active R&D base driving strong innovation economic inputs, but increasing expenditure alone does not guarantee stronger innovation outcomes.
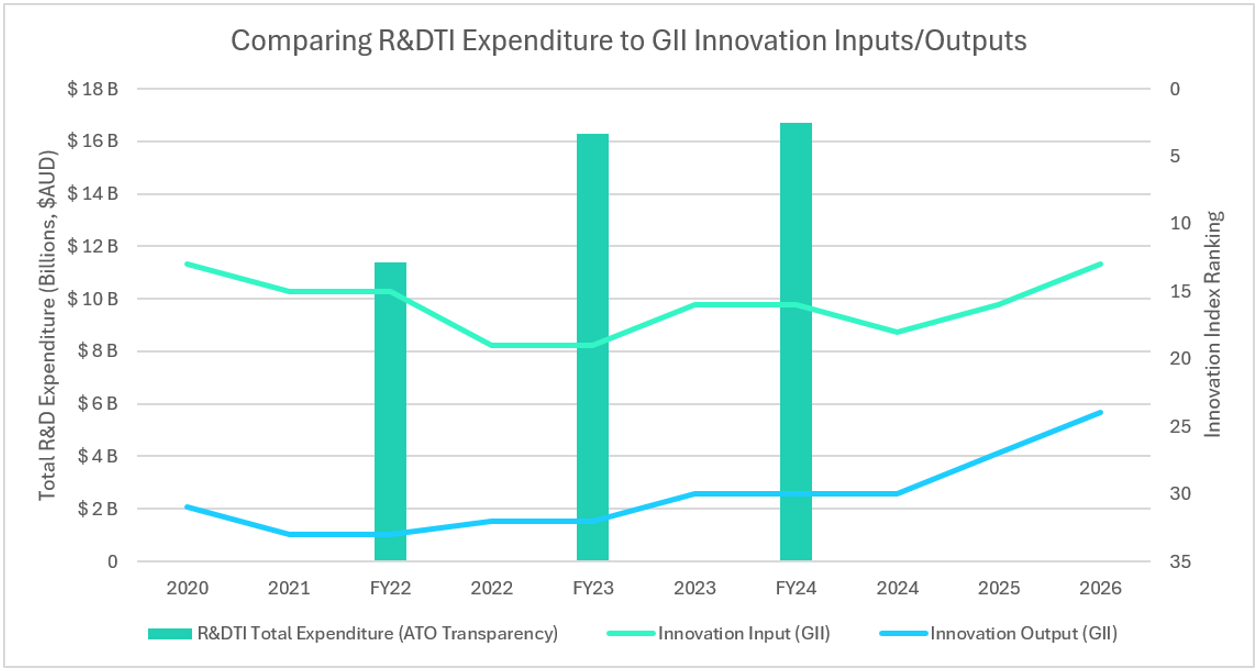
Figure 3: Comparing Innovation Input and Output trends against the R&DTI Expenditure. Note the reversed direction of the secondary axis. The lower the Innovation Input/Output value, the better.
The disconnect between innovation inputs and outputs shows that the translation of the R&D into high-quality and increased volumes of innovation output is not occurring effectively, despite the increasing R&D spend (including via R&D outlays from both companies and government through the R&DTI).
What Comes Next?
There are some important developments that may impact business R&D investment, the reported performance of the R&DTI program in future ATO transparency reports, and Australia’s position in global innovation rankings going forward:
The R&D activity registration process under the R&DTI was significantly expanded in August 2025, increasing the administrative burden on companies accessing the program. This change directly impacts the next R&DTI reporting period, and it will be informative to see what impacts program administration has on reported R&D investment (in particular, small business claimants).
Preliminary FY2024-25 R&DTI program reporting from the Department of Innovation Science & Resources (DISR) does not show the growth of the program slowing, with an estimated 14,000 claimants spending over $17.7 billion on R&D in FY2024-25 (DISR, 2025). However, the exact R&D expenditure numbers, distribution and growth details for this period will not be known until late 2027 when ATO’s fourth transparency report is released. The preliminary DISR 2025 and 2026 data showing continued R&DTI program growth does correlate with Australia’s improved GII position and innovation input index over 2025 and 2026 (WIPO, 2026; DISR, 2026).
From 1 July 2028, significant reforms to the R&DTI may come into effect if current draft legislation passes both houses of parliament. It is not yet clear the impact this will have on R&D expenditure within the R&DTI, or outside of it. Several of the proposed changes may improve R&D spend, whereas items like a 10-year restriction on access to the refundable R&D offset, an increase in the minimum expenditure threshold to access the program and the removal of supporting R&D activities entirely may impact the total expenditure claimed and scope of companies accessing the program. Though it may not be reported as part of the R&DTI program, R&D spending may still occur, uncaptured in ATO reporting, as companies decide that the benefit of conducting the R&D work outweighs the potential loss of the tax incentive.
Recent reductions in government support for commercialisation, including cuts to the popular Industry Growth Program and Australia's Economic Accelerator (AEA), risk further widening the gap between our innovation inputs and outputs. These programs play an important role in bridging the often challenging transition from research and technical development to market-ready products, scalable businesses and globally competitive industries. Without complementary investment in commercialisation, there is a risk that Australia will continue to fund the creation of new knowledge and technologies without capturing their full economic and societal value.
As Australia seeks to strengthen its global innovation performance, maintaining an appropriate balance between compliance, accessibility and effective support for Australian businesses to pursue genuine R&D, innovation collaboration and commercialisation will be critical.
R&D expenditure and incentives to invest in R&D continue to underpin Australia’s strong innovation input performance. However, the challenge is not simply encouraging a broadening of industry R&D expenditure, but ensuring that Australian businesses of all sizes are better able to translate that investment into meaningful commercial and economic outcomes.
References
ATO. (2026, September 23). Focus of the R&DTI report. Retrieved from Australian Taxation Office: https://www.ato.gov.au/businesses-and-organisations/income-deductions-and-concessions/incentives-and-concessions/research-and-development-tax-incentive/r-d-tax-transparency-reports/r-d-tax-incentive-transparency-report-2023-24/focus-of-the-r-dti-report
DISR. (2025, October 24). Transparency Portal. Retrieved from Department of Industry, Science and Resources Annual Report 2024-25: https://www.transparency.gov.au/publications/industry-science-and-resources/department-of-industry-science-and-resources/department-of-industry-science-and-resources-annual-report-2024-25
DISR. (2026, October 23). Department of Industry, Science and Resources. Retrieved from Annual report 2025–26: https://www.industry.gov.au/publications/annual-report-2025-26
WIPO. (2026). Australia ranking in the Global Innovation Index 2026. WIPO.
WIPO. (2026, September 29). World Intellectual Property Organization. Retrieved from GII 2026 results: https://www.wipo.int/web-publications/global-innovation-index-2026/en/gii-2026-results.html